Ranked: The World’s 20 Largest Economies, by GDP (PPP)
Born during the 1970s oil crisis, the G7 emerged as a group of the world economy’s cool kids: large, mature, high-income economies dominating key global sectors.
Ranked: The World’s 20 Largest Economies, by GDP (PPP)
This was originally posted on our Voronoi app. Download the app for free on iOS or Android and discover incredible data-driven charts from a variety of trusted sources.
Born during the 1970s oil crisis, the G7 emerged as a group of the world economy’s cool kids: large, mature, high-income economies dominating key global sectors.
Then, in the 2000s, BRICS showed up—a collection of countries mostly from the “Global South”— vying for influence with their steadily growing economic might, boosted by globalization. Now they’re positioned as competitors to the G7.
Together, both groups are in the G20, the world’s 20 largest economies, which accounts for 70–85% of the world economy (depending if nominal or PPP-adjusted GDP is used).
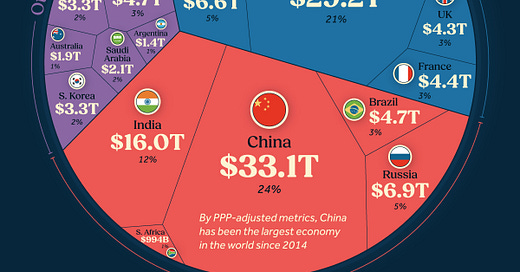
This chart shows the value of each G20 member’s GDP in 2024, adjusted for purchasing power parity (PPP). Data is sourced from the International Monetary Fund as of October, 2024.
All figures are rounded and in International dollars.
Ranked: G20 Countries, by PPP-Adjusted GDP (2024)
Since 2014, China has been the world’s largest economy by PPP-adjusted output. By market exchange rates, it’s still second in the world.
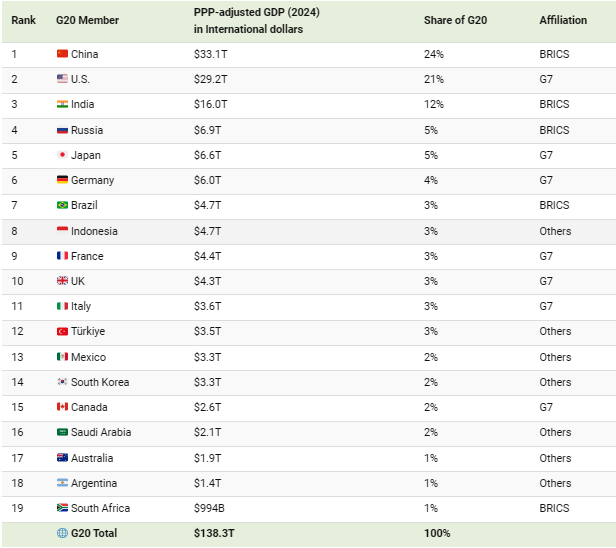
Meanwhile, here’s all G20 members ranked by their PPP-adjusted GDP in 2024.
At second place, the U.S. is about $4 trillion behind China by this particular metric.
India is ranked third, with its PPP–adjusted GDP nearly four times that of its nominal GDP and Russia and Japan round out the top five.
When looking at it through the lens of geopolitics, the BRICS countries are doing better collectively than the G7, aided in great part by India’s massive boost.
Why Use PPP-adjusted GDP?
First, how is this even calculated? In simple terms: a country’s GDP is converted into a common currency (International dollars) using exchange rates that account for differences in price levels between countries. This ensures that the same basket of goods and services has the same cost across nations, reflecting real economic output.
The upside of using this is that the relative strength of low and middle income countries is accounted for, since costs are lower than their high income counterparts.
This is why India’s PPP-adjusted GDP is so much higher compared to its nominal one.
There are criticisms of this. To create a common basket of goods assumes that people everywhere buy the same types of goods and services, which isn’t always true. Then, the data used for these calculations, especially in developing countries, can be outdated or unreliable.
It also doesn’t account for differences in the quality of products or the structure of different economies. And while adjusting for cost of living can be useful, actual currency exchange rates are still needed for trade and investment decisions, making it less practical in some cases.
Happy Holidays from the Art of Liberty Foundation!
We Goofed! Our discount code for 20% didn’t work on December 8th so we are extending the 20% discount until midnight on Thursday, December 12th!
Celebrate the season with special discounts:
20% off from December 5th-12th with the code Liberty20
15% off from December 13th-16th with the code Liberty15
10% off from December 17th until Christmas with the code Liberty10
Shop for unique books and gifts now at Government-Scam.com/store and make this holiday season extra special!


